Mahipal-Z-Portfolio
Listed below are the data driven projects I have worked on. This page gives an idea about how various business problems can be solved with the help of data science tools and technology.
PART-1: Data Analysis and Visualization
1. Exploratory data analysis of the top 400 video games released since 1977
Problem Description: The objective was to do a market research analysis of video games sector by identifying release years that users and critics liked best and exploring the business side of gaming by looking at game sales data.
Problem Type: Exploratory Data Analysis (EDA)
Solution: Compared the sales dataset with the critic and user reviews to determine whether video games have improved as the gaming market has grown. Found answers to several business questions using joins, set theory, grouping, filtering, and ordering techniques.
Impact: The findings from this analysis provides insights to developer team that helps them finalize the Game Design Document during the pre-production stage.
Tools & Technology: Relational databases, PostgreSQL

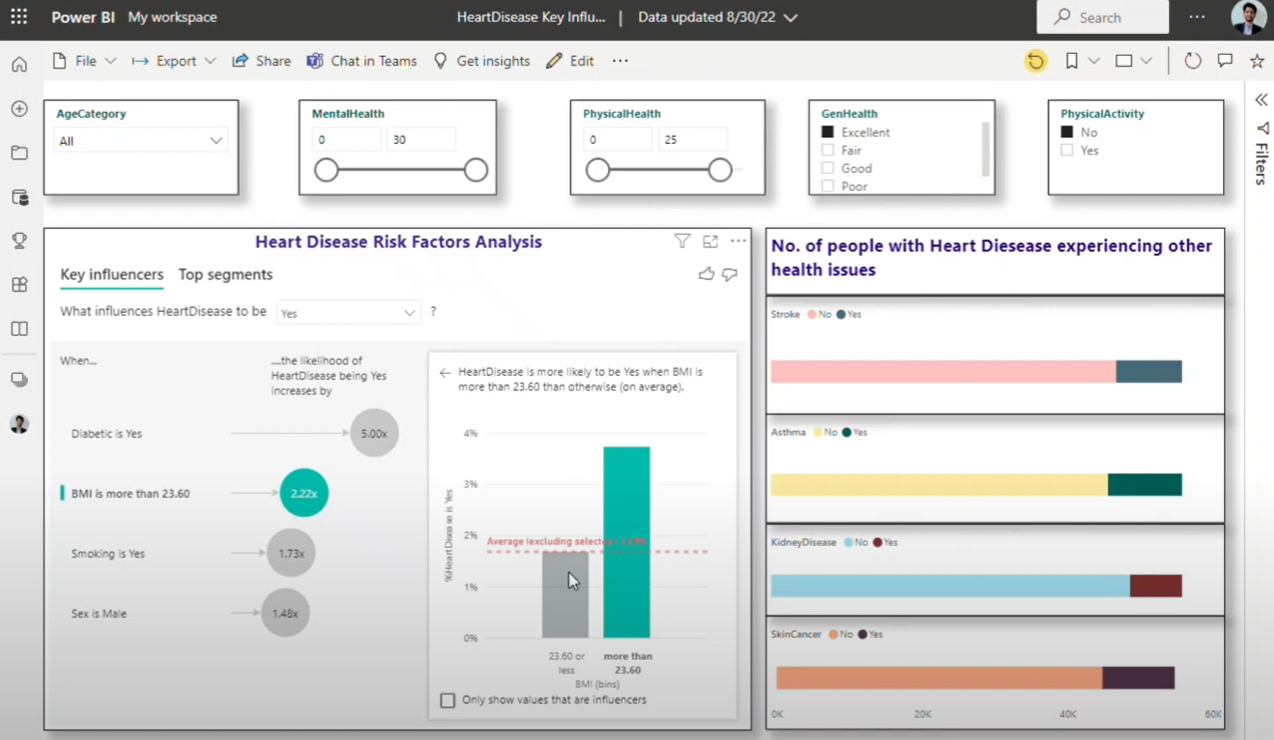
2. Identifying key factors influencing heart disease using 2020 annual CDC survey data of 400k adults
Problem Description: Project’s goal was to build an interactive dashboard from the dataset of patients with heart disease and investigate what factors impact the most in the diagnosis of heart disease.
Problem Type: Dashboard and Reporting
Solution: Developed a live visual report which displays the relationship between likelihood of having a heart disease with factors such as age, gender, lifestyle, etc. using slicers, bar plots, and filters by integrating a Kaggle dataset into Microsoft PowerBI.
Impact: The dashboard provides a quick overview of findings from the data set and the accessibility to dig deeper into each section of the analysis.
Tools & Technology: PowerBI, Relational Databases
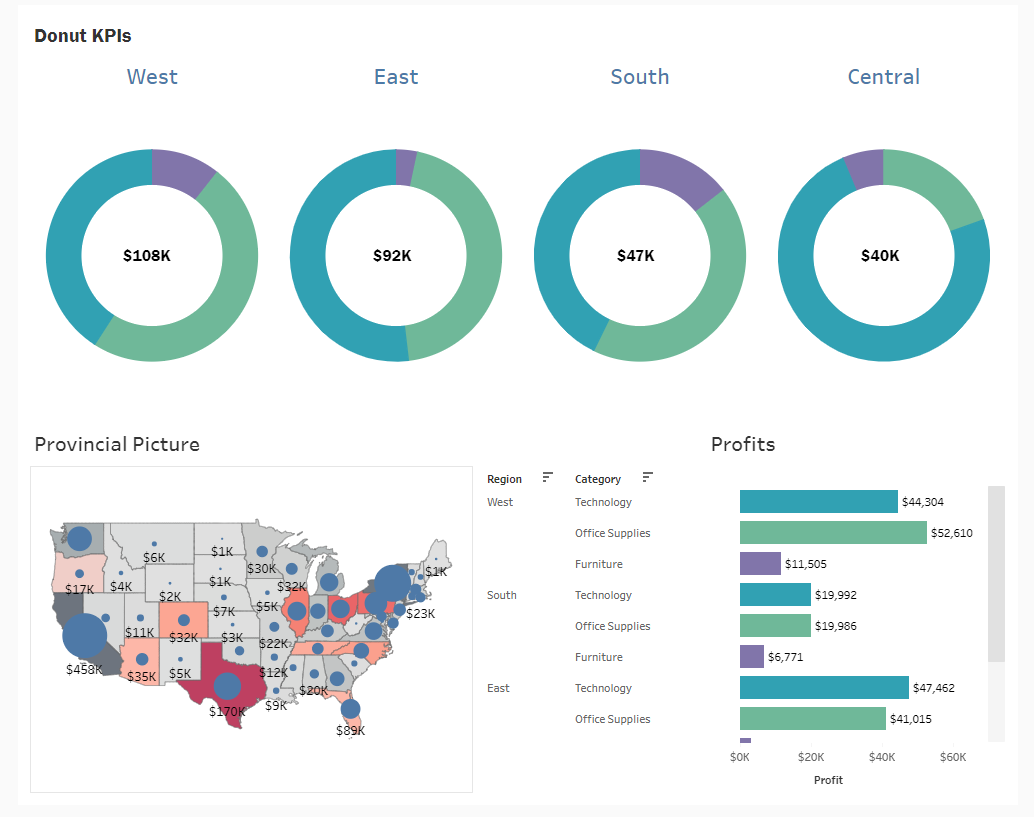
3. Retail store KPI Dashboard
Problem Description: The goal was to analyse the dataset containing information related to Sales, Profits, and other interesting facts of a superstore giant and publish a dashboard.
Problem Type: Dashboard and Reporting
Solution: Validated the dataset, integrated with Tableau, analysed data in worksheets and summarised using an overview dashboard.
Impact: The report provides a sneak peek of sales and profit numbers in different regions of the United States with filtering ability to categorize and group data.
Tools & Technology: Tableau, Donut charts, Maps
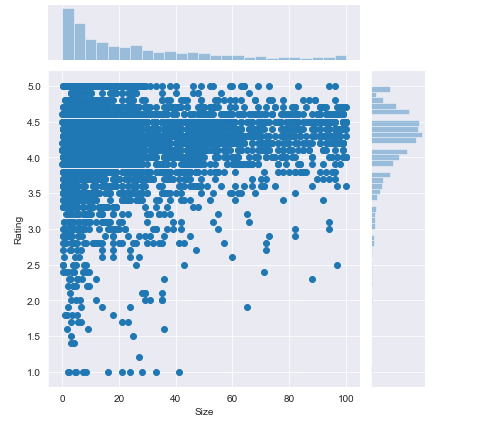
4. Comprehensive analysis of the android app market by comparing over 10,000 apps in Play Store
Problem Description: The objective was to look for insights in the data to devise strategies to drive growth and retention.
Problem Type: Data Analysis and Visualization, Sentiment Analysis
Solution: I did the exploratory data analysis to answer important business questions on app categories, size, and pricing on Google Play Store. Cleaned and merged tables to explore the user ratings and plotted sentiment polarity score.
Impact: The findings from this analysis can help decide what type of apps to develop, how much it should be priced and identify what makes users happy.
Tools & Technology: Relational databases, Python, Pandas, Plotly
5. Simulation of Airport Check-in System
Problem Description: The goal was to measure the effect of various factors on real time performance of an airport’s check-in operations. Additionally, management wanted to have a strategy that can minimize the operations cost without hurting the customer satisfaction score.
Problem Type: Data Visualization, System Engineering, Operation Research
Solution: Using data collected for a week, I built and executed a model in a simulation software that can report a real-time percentage of passengers satisfied/dissatisfied by using the airport check-in service.
Also, provided an experimenter tool that provides resource allocation solution that improved customer service with minimum cost.
Impact: For the given business case, the model saved $190,000 in opportunity cost and $255,000 of operations cost.
Tools & Technology: Witness Horizon, Witness Action Language
PART-2: Machine Learning
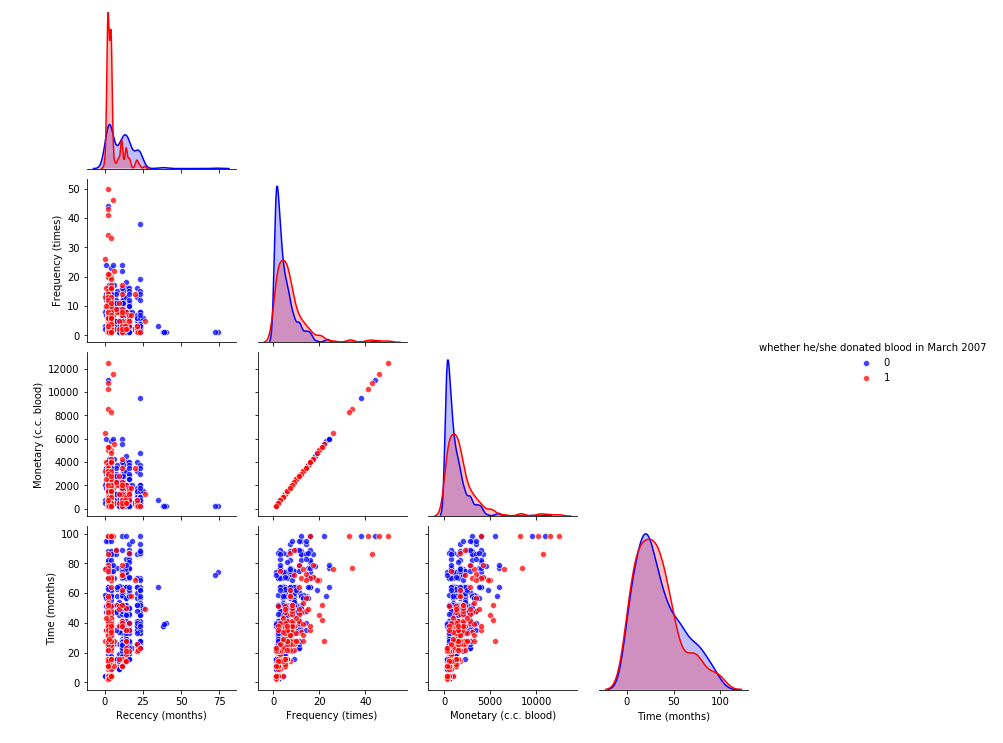
6. Blood Donations Prediction
Problem Description: The dataset owners are interested in predicting if past blood donors will donate again during the next collection date as part of an effort to forecast blood supply to mitigate potential supply shortages.
Problem Type: Supervised Learning, Binary Classification
Solution: By performing in-depth data cleaning and training and testing several classifiers, including Logistic Regression and K-Nearest Neighbors with Repeated Stratified K-Fold cross validation, I produced a model that outperforms the ZeroR baseline accuracy by 5.3%.
Impact: This model offers the Blood Transfusion Service Center in Hsin-Chu City in Taiwan a more realistic estimate of the number of donors to expect, allowing them to derive a more accurate forecasting of future blood supply and take appropriate action to address potential shortages.
Tools & Technology: Python, Scikit-Learn, Jupyter Notebook
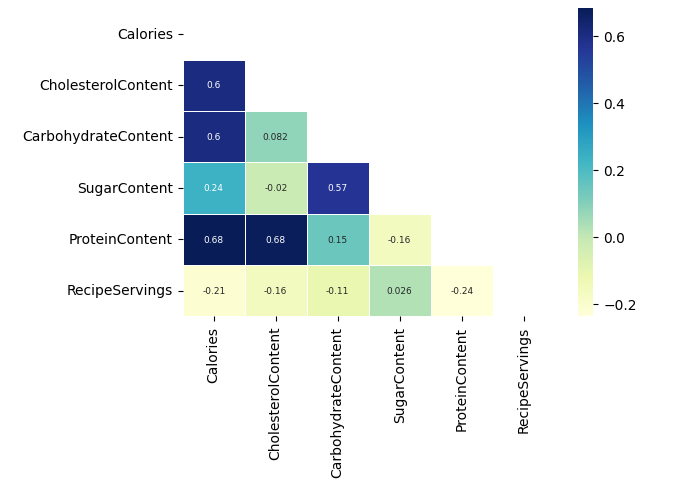
7. Rating Prediction for a Recipe Website
Problem Description: An online recipe start-up owners wanted to increase website traffic by publishing recipes that are likely to receive high user ratings. To do so, they want to avoid publishing recipes with potentially low ratings. They wanted to know if it is possible to detect recipe ratings using past data.
Problem Type: Binary Classification, Natural Language Processing
Solution: Using NLP techniques to extract features from recipes’ text, dimensionality reduction to distil the features, oversampling to balance the dataset, and hyperparameter tuning to identify the best hyperparameters, I developed an XGBoost classification model with an 18% higher recall value than the client’s expectations. Based on this model, I identified and provided the client with recommendations to increase website traffic.
Impact: The model can help strategize future content publication, forecast user ratings, and increase website traffic.
Tools & Technology: Jupyter Notebooks, DataCamp dataset, Pandas, nltk library, Scikit-learn
8. Predicting Credit Card Approvals using a UCI Machine Learning Repository dataset
Problem Description: The project’s objective was to reduce the time and cost of the credit card application screening process. This cost reduction will allow banking clients to offer online financial advising services for free to new customers opting for an upgraded credit card account.
Problem Type: Binary Classification, Financial Analysis, Risk Analysis
Solution: After one-hot encoding, and mean imputation on dataset, I developed a Logistic Regression model achieving the target classification accuracy using MinMaxScaler and Grid Search cross validation and Found insights that can help provide financial advice to customers for building high credit score.
Impact: The model automates the initial screening process of credit card application, saving banks time and resources.
Tools & Technology: Jupyter Notebooks, Pandas, Numpy, Scikit-learn

9. Performance prediction of Laboratory equipment
Problem Description: Fluid mechanics lab costs much time and capital in running same experiments several times during a semester for educational purpose. We wanted to develop a tool that can predict the performance of centrifugal blower, a lab equipment, accurately to avoid performing actual experiments on it.
Problem Type: Supervised Learning, Linear Regression
Solution: Collected the past experimental data for the equipment and performed some experiments using combinations of different variables. Trained a regression model using a neural network tool and achieved 0.92 of coefficient of determination (R squared).
Impact: The tool improved teaching process and learning experience by providing a flexibility to perform experiments in class when Laboratory is unavailable.
Tools & Technology: Visual Gene Developer, Neural Networks